INTspector app

KRIWAN INTspector app

The INTspector app developed by KRIWAN provides you with comprehensive insights into your devices and systems, from compressors to industrial pumps to refrigeration systems. Whether fault analysis, switching cycles, or operating times - with the INTspector app, a wide variety of data and measured values can be analyzed in detail and also recorded over a longer period of time in order to map and report processes transparently.

Whether via PDF report or the live diagnosis function, the INTspector app supports your service technicians in diagnosing faults and conditions on site - quickly, easily and effectively. KRIWAN protection relays, oil level regulators, differential pressure sensors and other devices can be conveniently parameterized via the INTspector app and are thus perfectly adapted to the individual conditions on site.

What options does the KRIWAN INTspector app offer?

This video is embedded by YouTube. The data protection conditions of Google apply (link)

The connection to your smart protection relay

The application possibilities of the KIRWAN INTspector App are manifold. When commissioning a KRIWAN diagnostic device, for example, you have the option of installing a predefined parameter file for your device. Of course, you can also carry out individual parameterization of temperature, switch-off times and other important device parameters. In addition, the app enables a clear display of the various operating data of your system and thus serves for status and error diagnostics.

Using the example of the comprehensive protection relay for pumps, the KRIWAN INT69 PYF Premium, we will introduce you to the most essential functions of the INTspector app. The range of functions and the display in the INTspector App may differ depending on the KIRWAN device used.

The INTspector app can be used for the following tasks:

  • Commissioning
  • Parameterization
  • Maintenance work
  • Troubleshooting
  • Status diagnosis

Diagnostic Data

The diagnostic data function gives you a comprehensive insight into your system, from an industrial pump to a refrigerant compressor. You receive detailed information on the motor status, motor temperature and other connected sensor signals.

Our various protection relays and devices with diagnostic functions enable you to comprehensively monitor operation-relevant data and sensor signals. This data is processed for you in a clear and easy-to-understand manner with the help of the KRIWAN INTspector app. This saves you time and costs, for example, when assessing the condition of the devices or even the whole system.

In the following, we present selected evaluations of sensor signals that the INTSpector App function "Diagnostic data" enables you to perform:

  • Motor temperature
  • Temperature
  • Cos Phi monitoring
  • Event list
  • Live diagnosis


Motor temperature

The motor temperature monitoring is used to protect the device (e.g. the pump or the compressor) from damage due to overheating. The motor temperature of the device is monitored, for example, with a PTC, a Pt100, a Pt1000 or a bimetal switch.

If the nominal response temperature is reached with a PTC, the alarm relay switches off without delay.

If the set temperature limits are reached with a Pt100 or Pt1000, the alarm relay or warning relay switches off after the adjustable tripping delay.

The bimetal switch is usually located in the motor winding. When the set temperature limits are reached, the bimetal switch opens and the alarm relay switches off without delay.


Temperature

Additional temperature inputs are available to protect the device from damage due to overheating, for example for an additional motor temperature sensor or a bearing temperature sensor. The motor or bearing temperature of the device is monitored with a PTC, a Pt100, a Pt1000 or a bimetal switch.

If the nominal response temperature is reached with a PTC, the alarm relay switches off without delay.

If the set temperature limits are reached with a Pt100 or Pt1000, the alarm relay or warning relay switches off after the adjustable tripping delay.

The bimetal switch is usually located in the motor winding. When the set temperature limits are reached, the bimetal switch opens and the alarm relay switches off without delay.

Cos Phi monitoring

Cos φ monitoring (a function currently only available on the INT69 PYF PREMIUM) is possible with the current transformer and phases connected and is used to detect underload (e.g. dry running) on the pump and protect the pump from damage. The monitoring can be set to exceed or fall below and when the adjustable limits are reached, the alarm relay or the warning relay switches off after the adjustable tripping delay has elapsed.

Event list

All events such as errors, warnings and messages are stored in a non-volatile internal memory and can be read out via the diagnostic port and the INTspector app. Since each event is stored with a time stamp, it is possible to transparently trace which event occurred and when. This supports on-site troubleshooting, for example, by enabling rapid troubleshooting.

Live diagnosis

In the live diagnosis, all sensor data (for example, motor temperature, leakage, cos φ, current, analog input, etc.) are recorded over time and can be viewed here. This supports fast troubleshooting and provides information about the status of the device being monitored. All sensor data is also written to a text file.

Evaluate operating data - simply, quickly and clearly

PDF report

The PDF report presents all important operating figures simply and clearly on the basis of the monitored sensor signals. Various diagrams enable you to make a quick assessment, for example when diagnosing faults. You will receive information on the operating time, the number of shutdowns and the motor running time.

All data and diagrams such as operating time, running time and switching cycles of the device, number of events, parameter list etc. are clearly stored in a PDF file. This is used for documentation purposes, for example in the event of a fault. Since it is possible to trace which events occurred and which parameters were set, this enables fast troubleshooting and transparent complaint handling. The PDF report can be sent by e-mail using the "Send folder" function, for example, if support is required from KRIWAN.


Parameterization mode

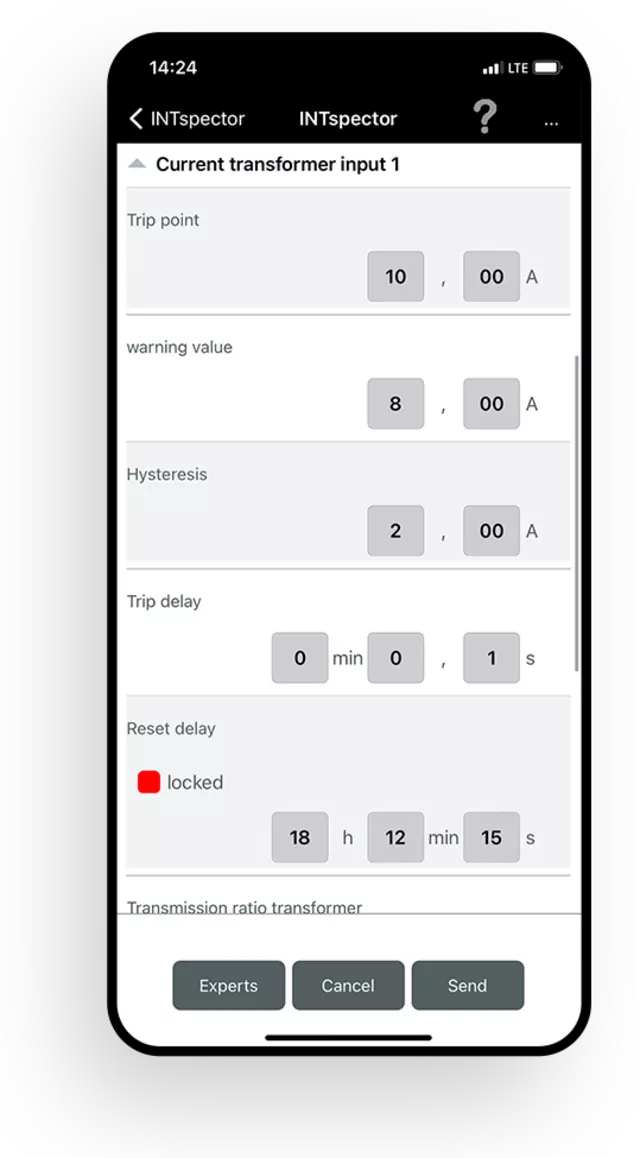
You have the option of setting various parameters of the diagnostic device to the specifics of your application. This enables application-related and situation-dependent adjustments to your KRIWAN protection relay.

Motor temperature

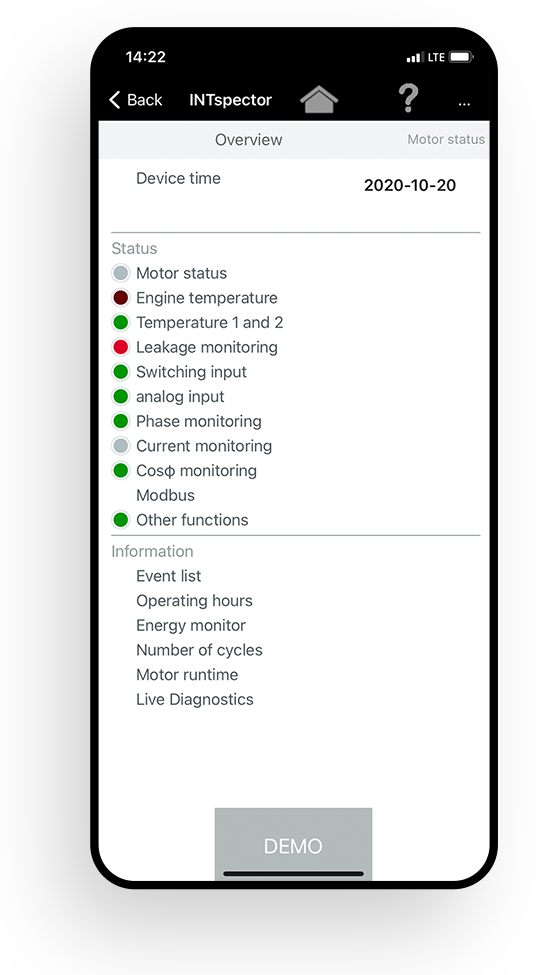
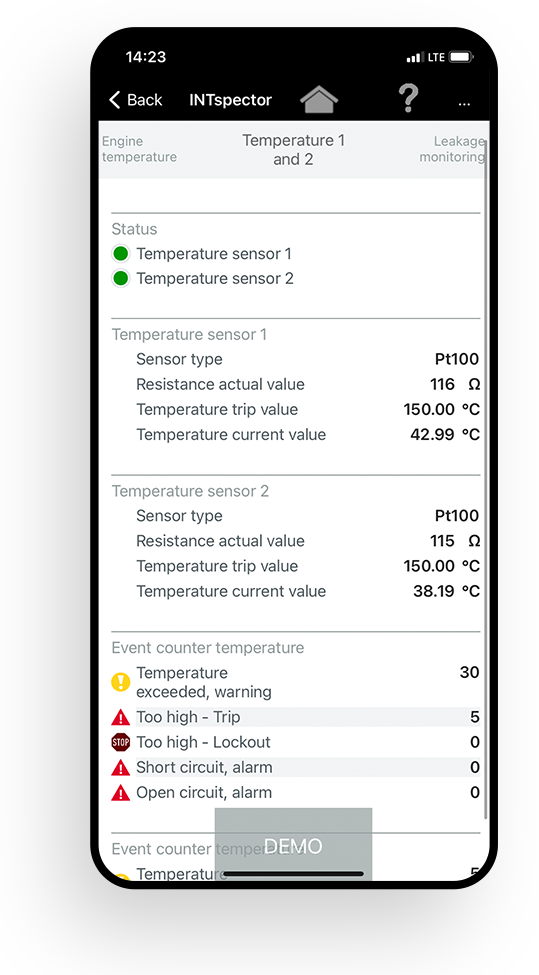
Choose between different sensor types to monitor the temperature of your device. Set the warning temperature individually depending on the situation and system.

Power monitoring

The power monitoring operates via a connected current transformer that monitors the current of phase L1 for overcurrent or undercurrent. Set the switch-off value and the warning value for the current monitoring. Maximum flexibility is provided by setting the tripping delay and the restart delay.

Phase monitoring

Choose between single-phase or three-phase monitoring.

Cos φ monitoring

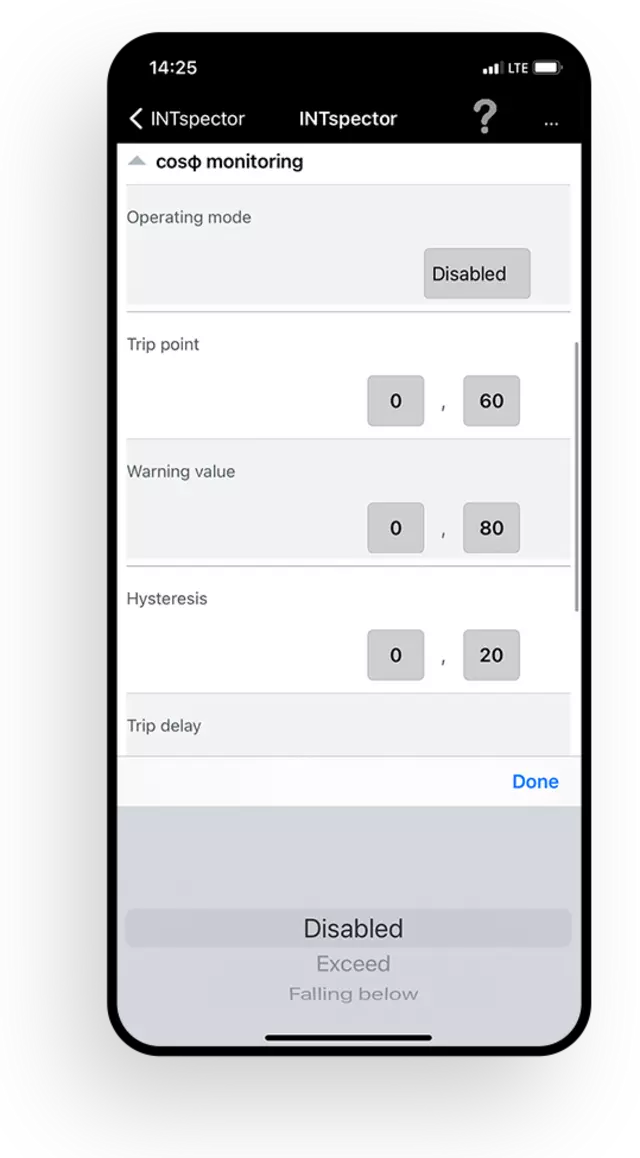
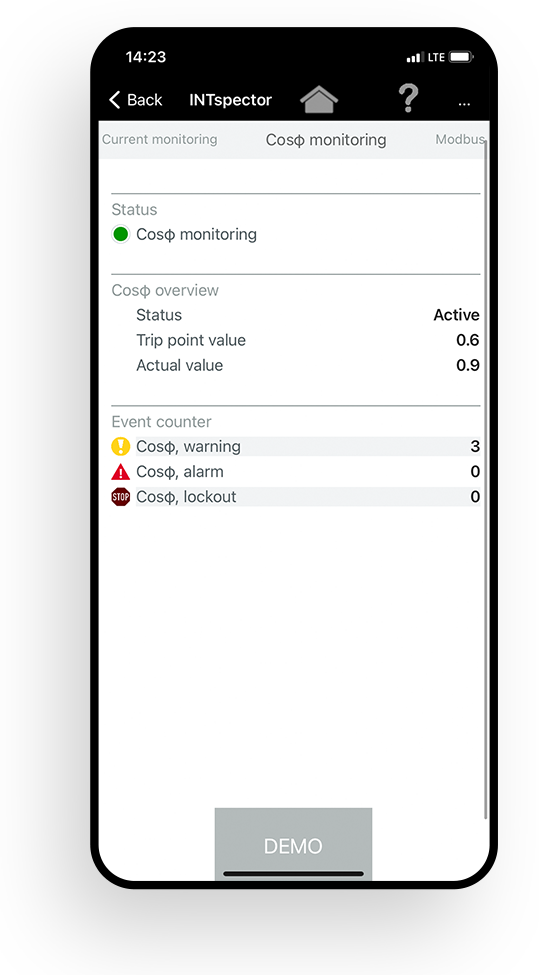
The monitoring of Cos φ can be set to exceed or fall below, and switches off the alarm relay or the warning relay when the adjustable limits are reached after the adjustable tripping delay has elapsed.

FAQ about the KRIWAN INTSpector App

We answer your questions about the KRIWAN INTSpector App.

What is the KRIWAN INTspector App needed for?

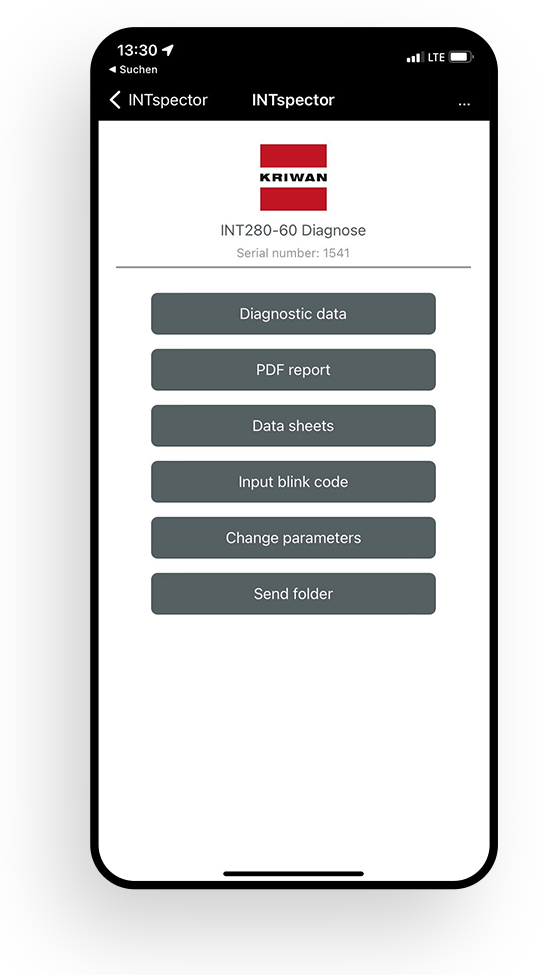
The KRIWAN INTspector App enables fast and targeted fault and status diagnostics on site. You connect the KRIWAN diagnostic device to the KRIWAN INTspector App via a gateway (INT600 DU gateway or INT600 DB gateway) and can thus perform commissioning (parameterization) and access all important operating data (diagnostics).

Which variants exist?

The KRIWAN INTspector App is available for Windows, Android and iOS.

Is the KRIWAN INTSpector app free of charge?

YES, the KRIWAN INTSpector app and all its functions are available to you free of charge.

What do I need to use the KRIWAN INTSpector app?

You need a KRIWAN device with diagnostic function, a KRIWAN USB or Bluetooth gateway and a mobile device (laptop, mobile phone, tablet) on which you have installed the KRIWAN INTSpector app. Please note that when using an Apple end device, it is mandatory to use a Bluetooth gateway.

How can I install the KRIWAN INTSpector app?

You have several options to install the KRIWAN INTSpector app. The easiest way is to install it via the App Store. You can find the links to the respective App Store at the bottom of this page. Another possibility is to download the Android APK file or the Windows exe file. Follow the installation instructions accordingly.

Which version of the KRIWAN INTSpector app do I have installed?

You can access the system information via the menu in the KRIWAN INTspector app. Below this you will find the menu item "version". If you have a support request regarding the KRIWAN INTspector app, please specify the system version; this makes it easier for our customer support to process your request as quickly as possible.

What can be saved with the KRIWAN INTspector App?

With the KRIWAN INTspector App, the diagnostic data can be saved as a kdd file and the parameter data as a kpd file. In addition, a pdf report can be created. With the Live Diagnosis function, a csv file is automatically generated in the background.

Does the parameterization have to be done individually each time?

After successful commissioning (parameterization), the parameter data can be saved as a kpd file and also loaded again. This means that they are also available for other KRIWAN diagnostic devices.

Who can I contact if I have questions or problems with the KRIWAN INTSpector app?

We will be happy to help you with questions and problems regarding the INTSpector App. You can submit a support request via the KRIWAN INTSpector App. You also have the option of sending us a request via our contact form. To do so, please select "INTSpector App" under subject. Our customer support will review your request and contact you.

Download KRIWAN INTspector App for free


Apple App Store is a trademark of Apple Inc.


Google Play is a trademark of Google LLC.


Microsoft Store is a trademark of Microsoft Corporation.


HUAWEI AppGallery is a trademark of Huawei Technologies Co., Ltd.


Android is a trademark of Google LLC.


Microsoft Store is a trademark of Microsoft Corporation.


You have further questions? Our experts will be happy to advise you!